Improving health and safety through machine learning and smart IoT devices.
Year
2020
Role
UI Design
Data Visualization
Industry
Oil & Gas
Outcome
Software ideation
Feasibility study
Background
Health and safety in an oil company are a bit more critical and complex than they would be at a grocery store for instance. Oil companies are considered to be at a high-risk level because the manufacturing process includes the extraction and production of oil and gas, which can jeopardize the health and safety of the people involved.
The Health and Safety department of an Oil Company wanted to automate their health and safety practices both on the field and inhouse by collecting data input from IoT devices, satellites and GPS trackers; and then analyzing the data using machine learning algorithms to predict instances where their operations may pose a danger to the environment, equipment or staff.
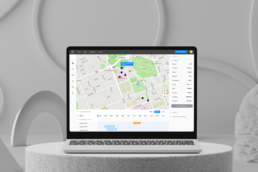
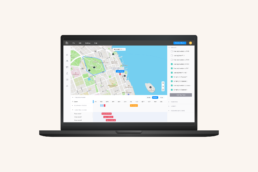
The goal was to design an interactive dashboard that would provide real-time and continuous monitoring of various company assets, visualization of data inputs and report generation for comprehensive risk assessments by the department.
These dashboard features would aim to mitigate potential working risks, and also enable efficient and prompt responses to emergencies if the need arises.
Some exploratory research was carried out to first identify the key monitoring needs of the HSE department and the various types of data that would be transmitted by the IoT devices.
Once the monitoring needs were clearly defined, it was easier to design a visualization framework that would interpret the data collected by those IoT devices.
- Facility monitoring: equipment monitoring, personnel monitoring, indoor mapping
- Environmental monitoring: gas dispersion, surface and groundwater quality, noise monitoring
Design
I designed the application to perform four basic functions.
Real-time monitoring: Having identified the monitoring needs above, the application was designed to track and monitor if there were any important events or changes in the status of the connected devices. It also provided users with the ability to effectively manage and maintain those devices.
Data collection and management: Additionally, various data points were transmitted from the connected devices, they include:
- Geospatial metadata; using NARSDA’s NIGCOMSAT -1R
- Realtime equipment statuses like flowrate, temperature, pressure, oil level, and vibration frequency; using IoT devices
- Operation history by field operating personnel; using status confirmation devices
- Realtime soil and water chemical values like salinity, PH value, moisture, and texture; using IoT devices
- Gas dispersion trajectory and smoke particle visibility; using IoT devices
- Personnel spatial location; using GPS tracker device
Risk assessment: Over time, using all the data that have continuously been fed into the system, users were able to perform risk assessments using pre-determined machine learning algorithms to efficiently access when equipment, personnel, or operational environment is at risk or unsafe at any point in time.
Insights and report generation: On successful risk assessment, users can then generate a report and submit it to a supervising officer, hence speeding up the decision-making process. This feature also allows users to set up alerts based on specific conditions, such as when a gas pressure exceeds a certain threshold.
Learnings
In this project, I was exposed to the potential hazardous risks oil companies face daily and the need to create awareness for the workers. With the interactive dashboard, work environments can be kept safe and dangerous situations can be detected and addressed on time, hence increasing work efficiency, reducing operational costs, and improving decision-making across the board.

